Support our educational content for free when you purchase through links on our site. Learn more
15 Raspberry Pi Sensor Data Logging Projects 🥧

Start with a BME280 or Sense HAT, log locally to CSV or SQLite, and add cloud dashboards only after your data is reliable. These Raspberry Pi sensor data logging projects can track temperature, humidity, pressure, air quality, soil moisture, motion, GPS, light, and more without requiring expensive laboratory equipment.
A Raspberry Pi is wonderfully patient: it can sit in a greenhouse for weeks, quietly recording every temperature swing while you get on with your day. We once built a room monitor that looked perfect on-screen, only to discover the script had overwritten its CSV file after every reboot. The sensor was blameless; the tiny w in Python was the culprit. 🕵️
This guide covers 15 builds, from beginner-friendly DHT22 and Sense HAT logers to MQTT networks, weather stations, vibration monitors, and low-power remote systems. You’ll learn which sensors fit each job, how often to sample, where to store readings, and how to keep your logger running when Wi-Fi disappears or the power cable gets nudged.
Key Takeaways
- Begin with the right sensor: Use a BME280, SHT31, or Sense HAT for environmental measurements; add an ADS1115 ADC for analog sensors.
- Choose a sensible sampling rate: Faster logging is not automatically better. Match the interval to how quickly the measured condition changes.
- Store data locally first: CSV suits short experiments, while SQLite or InfluxDB is better for long-running Raspberry Pi monitoring.
- Design for failure: Add timestamps, retries, offline buffering, automatic startup, backups, and protection against SD card corruption.
- Protect the GPIO pins: Raspberry Pi GPIO uses 3.3 V logic. Never connect a 5 V signal directly.
- Visualize useful information: Grafana, Node-RED, Home Assistant, Plotly, and Matplotlib can turn raw readings into clear trends and alerts.
- Validate before trusting: Calibrate sensors, compare readings with a reference, and monitor logger health alongside the measurements.
- Scale thoughtfully: A Raspberry Pi Zero 2 W suits compact projects, while a Raspberry Pi 4 or Raspberry Pi 5 handles databases, dashboards, and multiple services.
Table of Contents
- ⚡️ Quick Tips and Facts
- 🧭 Raspberry Pi Sensor Data Logging: What You Can Build
- 📚 The Evolution of Raspberry Pi Environmental Monitoring and Data Collection
- 🧰 Choosing the Right Raspberry Pi, Sensors, and Accessories
- Raspberry Pi Models for Data Logging
- Digital, Analog, I2C, SPI, and UART Sensors Explained
- Essential Hardware: Breadboards, Jumper Wires, ADCs, and Storage
- Power Supplies, Batteries, and Outdoor Enclosures
- 🛠️ Planning a Reliable Sensor Data Logger
- Define Measurements, Sampling Rates, and Project Goals
- Create a Safe Raspberry Pi GPIO Wiring Plan
- Choose Between Local, Cloud, and Hybrid Data Storage
- 🚀 15 Raspberry Pi Sensor Data Logging Projects
- 1. Temperature and Humidity Data Logger with DHT22
- 2. Precision Environmental Monitor with BME280
- 3. Sense HAT Weather and Room Data Logger
- 4. Outdoor Weather Station with anemometer and rain gauge
- 5. Soil Moisture and Smart Plant Monitoring System
- 6. Greenhouse Temperature, Humidity, and Light Logger
- 7. Air Quality and CO₂ Monitoring Station
- 8. Indoor Air Pollution Logger with a Particulate Matter Sensor
- 9. Light Intensity and Energy-Saving Data Logger
- 10. Raspberry Pi Sound Level Monitoring Project
- 11. Motion, Occupancy, and Door Activity Logger
- 12. Vibration and Machine Condition Monitoring Logger
- 13. Water Temperature, Level, and Leak Detection Logger
- 14. GPS Location, Speed, and Travel Data Logger
- 15. Multi-Sensor IoT Data Logger with MQTT and Node-RED
- 🐍 Installing Python Libraries for Raspberry Pi Sensors
- gpiozero, RPi.GPIO, and libgpiod
- I2C and SPI Communication Libraries
- Adafruit CircuitPython and Manufacturer SDKs
- 💻 Building a Python Sensor Logging Script
- Read Sensor Values Safely
- Add Timestamps and Time Zones
- Write Sensor Data to CSV
- Store Measurements in SQLite
- Handle Sensor Errors, Missing Values, and Retries
- Run a Logger Continuously with systemd
- 🗄️ Raspberry Pi Data Storage Options
- CSV Files for Simple Sensor Experiments
- SQLite for Reliable Local Logging
- InfluxDB and Time-Series Databases
- MySQL, PostgreSQL, and Remote Databases
- USB Drives, SSDs, and Network-Attached Storage
- 📊 Visualizing Raspberry Pi Sensor Data
- Grafana Dashboards for Real-Time Monitoring
- Plotly, Matplotlib, and Jupyter Notebook Charts
- Node-RED Dashboards and Home Assistant
- Exporting Data to Google Sheets and Cloud Platforms
- ☁️ Sending Sensor Readings to the Cloud
- MQTT Messaging with Mosquito
- HTTP APIs, Webhooks, and REST Services
- AWS IoT, Azure IoT, and Google Cloud Options
- Choosing the Best Internet Connection
- ⏱️ Sampling Rates, Calibration, and Measurement Accuracy
- How Often Should a Raspberry Pi Read a Sensor?
- Sensor Calibration and Baseline Testing
- Filtering Noise and Detecting Outliers
- Preventing Clock Drift and Incorrect Timestamps
- 🔒 Securing a Raspberry Pi IoT Data Logger
- Change Default Credentials and Disable Unecessary Services
- Use SSH Keys, Firewalls, and Automatic Updates
- Protect MQTT Brokers, APIs, and Cloud Credentials
- Back Up Sensor Logs and Recover from SD Card Failure
- 🔧 Troubleshooting Raspberry Pi Sensor Logging Problems
- Sensor Not Detected on the I2C Bus
- GPIO Permission and Python Module Errors
- Corupt CSV Files or Empty Database Tables
- Wi-Fi Dropouts and Cloud Upload Failures
- Overheating, Brownouts, and Random Reboots
- ✅ Testing and Validating Your Sensor Data Logger
- Bench Testing Before Field Deployment
- Compare Readings with a Trusted Instrument
- Monitor Uptime, Storage, and Sensor Health
- 🌦️ Deploying Raspberry Pi Data Logers Indors and Outdoors
- Weatherproofing and Condensation Protection
- Remote Monitoring and Maintenance
- Battery Life and Low-Power Design
- 📈 Improving Raspberry Pi Sensor Projects
- Add Alerts, Relays, and Automated Actions
- Scale from One Sensor to a Distributed Network
- Use Machine Learning for Forecasting and Anomaly Detection
- 🧪 Raspberry Pi Sensor Data Logging Project Ideas by Skill Level
- Beginer Raspberry Pi Logging Projects
- Intermediate Sensor Monitoring Projects
- Advanced Industrial and IoT Data Logging Projects
- ❌ Common Raspberry Pi Data Logging Mistakes to Avoid
- 🧾 Raspberry Pi Sensor Data Format and Privacy Considerations
- 🛒 Recommended Hardware and Software
- 🏁 Conclusion
- 🔗 Recommended Links
- ❓ FAQ
- Can a Raspberry Pi log sensor data without an internet connection?
- What is the best Raspberry Pi for sensor data logging?
- Which sensors work best with Raspberry Pi projects?
- How do I save Raspberry Pi sensor data to a CSV file?
- Can Raspberry Pi read analog sensors directly?
- How do I prevent SD card corruption?
- How accurate are Raspberry Pi sensor readings?
- How can I view Raspberry Pi sensor data remotely?
- 📖 Reference Links
Quick Tips and Facts
If you’re new to Raspberry Pi projects, sensor data logging is one of the best ways to turn a tiny computer into a patient little scientist. It can record temperature, humidity, pressure, light, motion, air quality, soil moisture, GPS coordinates, and much more.
Here are the essentials:
- ✅ A Raspberry Pi can log sensor readings locally without internet access.
- ✅ CSV files are excellent for small experiments and easy spreadsheet analysis.
- ✅ SQLite or InfluxDB suits longer-running projects with more frequent readings.
- ✅ The Raspberry Pi has no analog input pins, so analog sensors need an ADC such as the Adafruit ADS1115.
- ✅ I2C sensors can share the same two-wire bus, provided their addresses do not conflict.
- ✅ Sampling every second is not automatically better. Fast sampling creates larger files, more noise, and more storage wear.
- ✅ Use a real-time clock or network time when accurate timestamps matter.
- ❌ Never feed 5 V directly into Raspberry Pi GPIO pins. The GPIO operates at 3.3 V logic; the official Raspberry Pi GPIO documentation explains the electrical limits.
- ✅ The Sense HAT data logger project recommends elapsed-time checks rather than relying only on
sleep(), particularly when recording inertial measurement unit data. The official Raspberry Pi Sense HAT data logger tutorial is a useful reference. - ✅ A stable power supply matters as much as the sensor. A flaky cable can create “mysterious” data gaps that are really tiny electrical tantrums.
A quick project-selection guide
| Your goal | Recommended starting hardware | Storage approach | Typical sampling interval |
|---|---|---|---|
| Learn Python and CSV logging | Raspberry Pi 4 or Raspberry Pi 5 + BME280 | CSV | 5–60 seconds |
| Log motion and orientation | Raspberry Pi Sense HAT | CSV or SQLite | 0.1–1 second |
| Monitor plants | Raspberry Pi Zero 2 W + capacitive soil sensor + ADC | SQLite | 5–30 minutes |
| Build a weather station | Raspberry Pi 4 + BME280 + wind/rain sensors | SQLite or InfluxDB | 10–60 seconds |
| Measure air quality | Raspberry Pi 4 + Sensirion or Plantower sensor | InfluxDB | 1–60 seconds |
| Track a vehicle or hike | Raspberry Pi Zero 2 W + GPS module | CSV or SQLite | 1 second |
One small warning from our engineering bench: the most impressive-looking project is rarely the best first project. A humble temperature logger that runs for a week is more educational than a twelve-sensor contraption that crashes before lunch. 🧪
Raspberry Pi Sensor Data Logging: What You Can Build
A sensor data logger repeatedly measures physical conditions and stores each reading with a timestamp. The recipe is simple:
- Sense a physical quantity.
- Convert the electrical signal into a usable value.
- Timestamp the measurement.
- Store it locally or transmit it.
- Analyze trends, peaks, averages, and anomalies.
- Act when a threshold is reached.
That last step is where a logger becomes an automation system. A greenhouse monitor can switch on a fan, a freezer monitor can send an alert, and a vibration logger can flag a machine before it becomes an expensive paperweight.
Common measurements and compatible sensor families
| Measurement | Popular sensor examples | Interface | Useful projects |
|---|---|---|---|
| Temperature and humidity | Bosch BME280, Sensirion SHT31, DHT22 | I2C or digital | Room, greenhouse, weather |
| Pressure | BME280, BMP390 | I2C/SPI | Weather and altitude |
| Light | TSL2591, BH1750, Sense HAT | I2C | Daylight and energy studies |
| Motion | MPU6050, LSM6DS3, Sense HAT | I2C | Tilt, vibration, orientation |
| Air quality | SCD40, SCD41, PMSA003I, SGP30 | I2C/UART | CO₂ and particulate monitoring |
| Soil moisture | Capacitive probe + ADS1115 | Analog through ADC | Irrigation and plant health |
| Distance | HC-SR04, VL53L0X | GPIO/I2C | Tank level and occupancy |
| Location | u-blox GPS module | UART | Travel and asset tracking |
| Sound level | MEMS microphone board | I2S/USB/analog | Noise mapping |
| Electrical current | INA219, INA226 | I2C | Battery and power monitoring |
The central design question: how fast should you log?
Suppose you are measuring room temperature. Recording every millisecond would make the logger look very busy, but the room itself is not changing that quickly. You would mostly capture sensor noise and create an enormous dataset.
A useful rule is:
Choose a sampling interval based on how quickly the measured phenomenon can change, not on how quickly the computer can run.
| Application | Sensible interval | Why |
|---|---|---|
| Room temperature | 10–60 seconds | Thermal changes are slow |
| Soil moisture | 5–30 minutes | Soil water content changes gradually |
| Weather station | 1–60 seconds | Wind and rainfall can change quickly |
| Human motion | 10–100 milliseconds | Movement contains rapid changes |
| Machine vibration | 1–10 milliseconds or dedicated hardware | Important frequency content may be lost at slower rates |
| GPS position | 1 second | Common GPS update rate |
| CO₂ in a room | 5–60 seconds | Occupancy changes are comparatively slow |
The National Institute of Standards and Technology offers broader measurement guidance, while sensor manufacturers provide device-specific limits. For high-speed vibration, a Raspberry Pi running a general-purpose operating system may not be the right measurement instrument; a microcontroller or dedicated data-acquisition device can be a better front end.
What makes a good data logger?
A dependable logger should:
- Record a timestamp for every row.
- Identify missing or invalid readings.
- Flush data periodically without wearing out storage.
- Recover after a power interruption.
- Keep running if a sensor temporarily disconnects.
- Store units and calibration information.
- Provide a way to inspect health remotely.
- Avoid silently overwriting old data.
We once watched a prototype collect beautiful greenhouse readings for three days, only to discover that the script opened the CSV file with write mode on every restart. The result? A perfect three-day experiment reduced to the final afternoon. The sensor was innocent. The file mode was the villain. 🕵️
The Evolution of Raspberry Pi Environmental Monitoring and Data Collection
The Raspberry Pi began as an inexpensive educational computer, but its GPIO header, Linux operating system, Python ecosystem, and community hardware turned it into a remarkably flexible measurement platform.
Early projects commonly used:
- A GPIO-connected digital sensor.
- A short Python script.
- A CSV file.
- A command-line terminal and considerable optimism.
Modern projects increasingly add:
- I2C and SPI sensor breakouts.
- SQLite and time-series databases.
- Grafana dashboards.
- MQTT messaging.
- Docker containers.
- Cellular and LoRaWAN connectivity.
- Battery-backed power.
- Remote software updates.
- Data validation and alerting.
The Raspberry Pi Foundation continues to publish educational projects that demonstrate this progression. The official Sense HAT data logger tutorial is particularly useful because it combines several measurements into one CSV record.
Why the Sense HAT remains a strong teaching platform
The Sense HAT bundles:
- Temperature measurement.
- Humidity measurement.
- Barometric pressure.
- A color and brightness sensor.
- An accelerometer.
- A gyroscope.
- A magnetometer.
- An 8×8 RGB LED matrix.
- A joystick.
That combination lets learners explore environmental data and motion data without wiring a dozen separate modules. The official project records fields such as temp, pres, hum, orientation, acceleration, gyroscope readings, magnetometer values, light data, and a timestamp.
The tutorial’s approach also exposes an important engineering distinction: the measurement loop and the logging loop do not always need to run at the same speed. A sensor may be sampled quickly while only selected readings are written to a file.
A note about inaccessible forum discussions
Several Raspberry Pi forum URLs commonly appear in searches for sensor logging advice. Some pages may display security-verification messages such as “Performing security verification” instead of the actual discussion. When a forum thread cannot be accessed or verified, we do not treat it as evidence for wiring, code, sensor accuracy, or safety claims.
That is not a criticism of community forums. They are often tremendously helpful. But a forum anecdote, an official datasheet, and a controlled measurement are three different kinds of evidence. Trust each for what it can actually establish.
Choosing the Right Raspberry Pi, Sensors, and Accessories
The best hardware depends on the logger’s job. A Raspberry Pi 5 is excellent for dashboards, image processing, and multiple services. A Raspberry Pi Zero 2 W is better suited to compact, lower-demand monitoring. The official Raspberry Pi product documentation provides model-specific details.
Raspberry Pi Models for Data Logging
| Model | Best use | Strengths | Trade-offs |
|---|---|---|---|
| Raspberry Pi 5 | Multi-sensor gateway, Grafana, computer vision | Fast CPU, modern connectivity, strong expansion potential | Higher power consumption and thermal needs |
| Raspberry Pi 4 Model B | General-purpose logger and server | Mature software, Ethernet, USB, strong community support | More power than a Zero-class board |
| Raspberry Pi 3B+ | Existing projects and moderate logging | Large software ecosystem, built-in Wi-Fi | Older and less efficient |
| Raspberry Pi Zero 2 W | Compact remote logger | Small, low power, wireless connectivity | Fewer ports and less processing headroom |
| Raspberry Pico W | Dedicated low-power sensing | Excellent for deterministic sensor acquisition | Not a full Linux computer; different programming model |
| Raspberry Pi Compute Module 4 | Embedded product or custom carrier | Flexible industrial integration | More complex design and procurement |
For a beginner, we usually recommend:
- Raspberry Pi 4 Model B for a desktop-connected learning project.
- Raspberry Pi Zero 2 W for a small remote logger.
- Raspberry Pico W when battery life and low-power operation matter more than Linux software.
Pi 5, Pi 4, or Zero 2 W?
A Pi 5 can run a sensor logger easily, but “can” is not the same as “should.” If your project only reads a BME280 every minute and writes one CSV row, its extra performance is mostly idle. If it also runs Home Assistant, InfluxDB, Grafana, a camera stream, and a local dashboard, the Pi 5 starts earning its keep.
Our recommendation: match processing power to the workload, then spend the saved complexity on better power protection, storage, calibration, and enclosure design.
Digital, Analog, I2C, SPI, and UART Sensors Explained
Digital sensors
Digital sensors communicate using a protocol or provide a logic-level output. Examples include the DHT22 and DS18B20.
- Advantages: Simple conceptual model; no external ADC for many devices.
- Drawbacks: Some have slow response times, timing sensitivity, or modest accuracy.
I2C sensors
I2C uses two signal lines:
- SDA for data.
- SCL for the clock.
Many breakout boards can share one bus. Each device needs a unique address.
- Advantages: Only two signal wires; excellent for environmental sensors.
- Drawbacks: Address conflicts, cable-length limitations, and pull-up resistor issues.
The Raspberry Pi documentation explains how to enable and inspect I2C.
SPI sensors
SPI typically uses:
-
Clock.
-
Controller-out/controller-in data.
-
Controller-in/controller-out data.
-
One or more chip-select lines.
-
Advantages: Faster and often more deterministic than I2C.
-
Drawbacks: More wires and a chip-select line per device in many designs.
UART sensors
UART uses serial transmit and receive lines. GPS modules and some air-quality sensors commonly use UART.
- Advantages: Straightforward point-to-point communication.
- Drawbacks: Generally connects fewer devices per port; serial settings must match.
Analog sensors
The Raspberry Pi GPIO header does not measure analog voltage directly. For a resistive soil sensor or analog gas sensor, add an ADC such as:
The ADC converts voltage into a numerical value that Python can read.
Essential Hardware: Breadboards, Jumper Wires, ADCs, and Storage
A dependable starter kit includes:
- A quality microSD card designed for frequent use.
- A stable, certified USB-C or USB power supply where appropriate.
- Short jumper wires.
- A breadboard for protyping.
- A logic-level-safe sensor breakout.
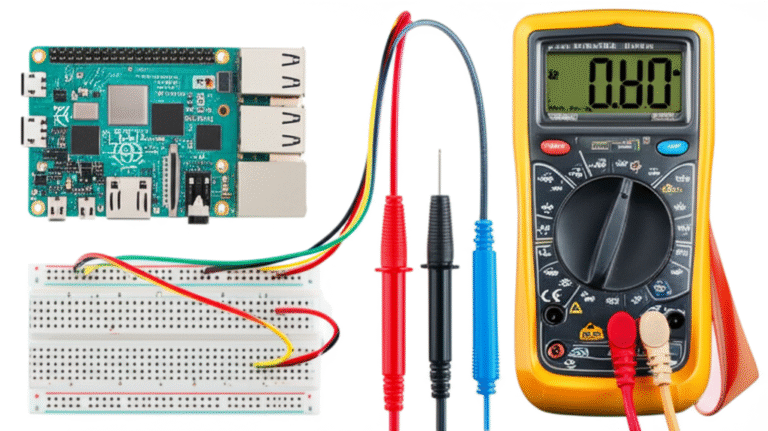
- A multimeter.
- Heat-shrink tubing or insulated connectors for field work.
- An ADC for analog sensors.
- A case with airflow where the Pi produces heat.
Brands such as Adafruit, SparkFun, Seed Studio, Bosch Sensortec, and Sensirion publish useful technical documentation. We prefer breakout boards with clearly labeled pins, level shifting where needed, and accessible libraries.
Power Supplies, Batteries, and Outdoor Enclosures
Power problems often masquerade as software problems:
- A brownout may corrupt a file.
- A weak USB cable may cause intermittent resets.
- A solar battery pack may shut down when current draw falls.
- A sealed enclosure may overheat the board.
- Condensation can short exposed electronics.
For outdoor projects, consider:
- A weather-resistant enclosure.
- Cable glands.
- Desiccant or a breathable membrane where appropriate.
- A small heater only when condensation control genuinely requires it.
- A battery-management system.
- Surge protection for long external sensor cables.
- A separate sensor enclosure if the Pi’s heat would bias temperature readings.
Do not place a temperature sensor beside the Raspberry Pi’s processor or voltage regulator and then call the result ambient temperature. That measurement is closer to “how warm is this plastic box becoming?”
Product rating table: useful data-logging hardware
| Product | Design | Functionality | Documentation | Beginner friendliness | Field suitability | Overall |
|---|---|---|---|---|---|---|
| Raspberry Pi 5 | 9/10 | 10/10 | 9/10 | 8/10 | 7/10 | 8.6/10 |
| Raspberry Pi Zero 2 W | 10/10 | 8/10 | 9/10 | 8/10 | 8/10 | 8.6/10 |
| Raspberry Pi Sense HAT | 9/10 | 9/10 | 10/10 | 10/10 | 6/10 | 8.8/10 |
| Bosch BME280 breakout | 9/10 | 9/10 | 9/10 | 9/10 | 8/10 | 8.8/10 |
| Sensirion SHT31 breakout | 9/10 | 9/10 | 9/10 | 9/10 | 8/10 | 8.8/10 |
| Adafruit ADS1115 | 9/10 | 9/10 | 10/10 | 9/10 | 8/10 | 9.0/10 |
| SanDisk High Endurance microSD | 8/10 | 8/10 | 8/10 | 9/10 | 8/10 | 8.2/10 |
Ratings reflect our practical experience with hobby and educational builds, not laboratory certification. Sensor accuracy still depends on installation, calibration, temperature, wiring, and software.
Product considerations in practice
- Raspberry Pi Sense HAT: Best for learning, demonstrations, and compact multi-sensor experiments. Its on-board components reduce wiring errors, though board self-heating can influence temperature.
- BME280: A superb general-purpose environmental sensor. Beware of counterfeit or incorrectly labeled breakout boards when buying from unknown sellers.
- SHT31: Often preferable when humidity quality matters more than pressure measurement.
- ADS1115: A strong choice for slow analog signals such as soil moisture, but not a high-speed vibration ADC.
- High-endurance microSD cards: Better suited to repeated writes than generic cards, but no SD card is immortal. Backups remain mandatory.
👉 CHECK PRICE on:
- Raspberry Pi 5: Amazon | Raspberry Pi Official
- Raspberry Pi Zero 2 W: Amazon | Raspberry Pi Official
- Raspberry Pi Sense HAT: Amazon | Raspberry Pi Official
- Bosch BME280 breakout: Amazon | Adafruit Official
- Sensirion SHT31 breakout: Amazon | Adafruit Official
- Adafruit ADS1115: Amazon | Adafruit Official
Planning a Reliable Sensor Data Logger
Before connecting wires, write down what “success” means. Otherwise the project tends to grow tentacles: one more sensor, one more dashboard, one more alert, and suddenly your weather station is running a small space program.
Define Measurements, Sampling Rates, and Project Goals
Create a requirements table:
| Question | Example answer |
|---|---|
| What will be measured? | Greenhouse air temperature and humidity |
| Where? | Inside a ventilated enclosure |
| For how long? | At least 30 days |
| How often? | Every 60 seconds |
| Required accuracy? | Approximately ±0.5 °C and ±3% RH |
| What happens offline? | Store locally and sync later |
| What happens after a reboot? | Start logging automatically |
| How will data be inspected? | Grafana dashboard and CSV export |
| What is the acceptable data loss? | Less than one interval |
| Who can access it? | One authenticated administrator |
This prevents a common mistake: choosing hardware before defining the measurement.
Create a Safe Raspberry Pi GPIO Wiring Plan
Use a wiring checklist:
- Identify the sensor’s supply voltage.
- Confirm its logic voltage.
- Find the sensor’s pinout in its official documentation.
- Identify I2C addresses or SPI chip-select requirements.
- Connect ground first.
- Connect power only after checking polarity.
- Add pull-up resistors only when the breakout board does not already include them.
- Keep sensor wires short during initial testing.
- Use a multimeter to verify voltage before plugging in the Raspberry Pi.
- Test one sensor at a time.
GPIO safety rules
- ❌ Never connect a 5 V signal to a 3.3 V GPIO input.
- ❌ Never drive a GPIO beyond its electrical limits.
- ❌ Never assume a breakout board includes level shifting.
- ✅ Use a logic-level converter when voltage domains differ.
- ✅ Use a transistor or relay driver for motors, pumps, and solenoids.
- ✅ Add a flyback diode for suitable inductive loads when using a transistor circuit.
- ✅ Check the Raspberry Pi GPIO electrical specifications before connecting unfamiliar hardware.
Choose Between Local, Cloud, and Hybrid Data Storage
| Architecture | Benefits | Weaknesses | Best fit |
|---|---|---|---|
| Local CSV | Simple, portable, easy to inspect | Fragile schema; awkward concurrent access | Short experiments |
| Local SQLite | Reliable structured storage | Needs a little database knowledge | Standalone logers |
| InfluxDB + Grafana | Excellent time-series dashboards | More services to maintain | Long-running monitoring |
| Cloud API | Remote access and backup | Needs network and credentials | Distributed deployments |
| Hybrid | Local resilience plus remote visibility | More design work | Serious field projects |
Our default recommendation is local-first: save readings on the Pi, then synchronize or publish copies. A Wi-Fi outage should create a data gap in the dashboard, not a data gap in the experiment.
15 Raspberry Pi Sensor Data Logging Projects
The following projects move from friendly beginner builds to more capable monitoring systems. Each one has a different “best tool” answer, so do not treat the list as a race to project number 15. The real victory is a logger that keeps recording after you stop admiring it.
1. Temperature and Humidity Data Logger with DHT22
The DHT22 is widely used in beginner projects because it is inexpensive, easy to understand, and available in many breakout formats. It is not the fastest or most precise humidity sensor, but it teaches the entire logging workflow.
Hardware
- Raspberry Pi.
- DHT22 or AM2302.
- 10 kΩ pull-up resistor if required by the module.
- Jumper wires.
- microSD card.
The Adafruit DHT sensor guide documents wiring and software considerations.
Build steps
- Connect the sensor’s ground to Raspberry Pi ground.
- Connect its supply according to the module’s documentation.
- Connect the data output to a GPIO pin.
- Confirm the data line has the required pull-up.
- Install the supported Python library.
- Read one value manually.
- Repeat the reading with a suitable interval.
- Write timestamped values to CSV.
- Run for several hours and inspect missing readings.
Strengths and weaknesses
✅ Strengths
- Easy to find.
- Beginner-friendly code.
- Good for classroom demonstrations.
- Provides temperature and humidity together.
❌ Weaknesses
- Slow response.
- Can return invalid readings if poled too quickly.
- Humidity accuracy is limited compared with better I2C sensors.
- Long wires can create reliability problems.
For a basic indoor comfort logger, it works. For a serious greenhouse study, we prefer a BME280 or SHT31.
2. Precision Environmental Monitor with BME280
The BME280 measures temperature, humidity, and barometric pressure over I2C or SPI. It is one of our favorite general-purpose Raspberry Pi sensors because the interface is clean and the data is useful.
Project architecture
BME280 ─I2C──> Raspberry Pi ─> SQLite/CSV ─> Grafana or Python chart
``

#### Build steps

1. Enable I2C using Raspberry Pi OS configuration tools.
2. Wire 3.3 V, ground, SDA, and SCL.
3. Run `i2cdetect` to confirm the device address.
4. Install a library from a reputable provider such as [Adafruit](https://learn.adafruit.com/adafruit-bme280-humidity-barometric-pressure-temperature-sensor-breakout/python-circuitpython-test-test).
5. Read the sensor values.
6. Add a UTC timestamp.
7. Validate that values fall within realistic ranges.
8. Store readings in SQLite or CSV.
9. Graph temperature and pressure over 24 hours.

#### Watch the temperature reading

A sensor mounted directly above the Raspberry Pi can report a warmer temperature because of processor heat. For ambient measurements:

- Use a short extension cable where practical.
- Ventilate the sensor.
- Avoid placing it inside the Pi’s warmest cavity.
- Compare it with a trusted thermometer.

### 3. Sense HAT Weather and Room Data Logger

The Sense HAT is a compact teaching platform and a natural fit for a Raspberry Pi sensor data logging project.

The official [Sense HAT data logger project](https://projects.raspberrypi.org/en/projects/sense-hat-data-logger) demonstrates a Python logger that writes sensor readings to a CSV file and allows the delay between records to be changed.

#### Recorded data

The tutorial includes fields for:

- Temperature.
- Pressure.
- Humidity.
- Red, green, blue, and clear light readings.
- Yaw, pitch, and roll.
- Magnetometer axes.
- Accelerometer axes.
- Gyroscope axes.
- Date and time.

#### Why timing matters

The tutorial warns that using `sleep()` alone can lead to inaccurate readings from some IMU sensors. Instead, it checks the elapsed time between timestamps and writes a row when the configured interval has passed.

That distinction is subtle but valuable:

- `sleep()` pauses the whole loop.
- Timestamp comparison lets the program measure elapsed time explicitly.
- A high-frequency acquisition loop can remain responsive while logging less frequently.

The project’s example uses a configurable delay, such as one second, and checks the time difference before writing a row.

#### Our practical improvement

For a more robust logger:

- Use timezone-aware timestamps.
- Use `total_seconds()` rather than relying on a seconds-only field.
- Flush or batch writes deliberately.
- Catch sensor exceptions.
- Add a clean shutdown handler.
- Store a software version and sensor configuration alongside the data.

The Sense HAT is not merely a colorful board. It is a compact lesson in **multivariate data acquisition**, where several sensors have different response times and noise characteristics.

### 4. Outdoor Weather Station with anemometer and rain gauge

A weather station combines slow environmental measurements with event-based signals.

#### Typical sensors

- BME280 or SHT31 for temperature and humidity.
- BMP390 or BME280 for pressure.
- Anemometer for wind speed.
- Wind vane for direction.
- Tipping-bucket rain gauge.
- UV or light sensor.

#### Data model

| Field | Example type | Logging method |
|---|---|---|
| Air temperature | Float | Periodic |
| Relative humidity | Float | Periodic |
| Pressure | Float | Periodic |
| Wind speed | Float | Count pulses over interval |
| Wind direction | Integer/float | Analog or resistor ladder |
| Rainfall | Event count | Interrupt or polling |
| Battery voltage | Float | ADC |

#### Build steps

1. Mount temperature and humidity sensors away from heat sources.
2. Protect electronics from rain while allowing accurate air exposure.
3. Count anemometer pulses over a defined window.
4. Record tipping-bucket events.
5. Convert raw counts using manufacturer calibration factors.
6. Store both raw counts and converted values.
7. Calculate averages, maximum gusts, and rainfall totals.
8. Add a local backup before transmitting data.

The [National Weather Service](https://www.weather.gov/) provides useful context for weather observations, but a hobby station should not be presented as a certified meteorological instrument without proper calibration and siting.

### 5. Soil Moisture and Smart Plant Monitoring System

A plant logger can answer questions such as:

- Does the soil dry faster near a window?
- Does watering once deeply outperform frequent small watering?
- How does pot size affect moisture retention?
- Is the plant being overwatered?

#### Recommended design

Use a **capacitive soil moisture sensor** rather than an exposed resistive probe for longer deployments. Resistive probes can corode and their readings may drift with soil chemistry.

Because the Raspberry Pi lacks analog inputs, connect the sensor to an ADC such as the [ADS1115](https://www.adafruit.com/product/1085).

#### Calibration steps

1. Place the probe in dry soil.
2. Record the ADC value.
3. Saturate the soil with water and allow excess water to drain.
4. Record the wet value.
5. Repeat in the actual soil mix.
6. Map the raw value to a relative moisture percentage.
7. Validate against plant behavior rather than trusting the percentage label blindly.

A reading of “62% moisture” is not a universal truth. It is a calibrated interpretation of a voltage in a particular soil, with a particular probe, at a particular temperature.

### 6. Greenhouse Temperature, Humidity, and Light Logger

A greenhouse introduces rapid changes:

- Direct sunlight can heat the enclosure quickly.
- Condensation can affect sensors.
- Fans create local differences.
- Watering events disturb humidity.
- The Raspberry Pi itself adds heat.

#### Suggested sensor set

- SHT31 for temperature and humidity.
- BH1750 or TSL2591 for light.
- Soil moisture sensor plus ADC.
- Optional CO₂ sensor.

#### Useful derived values

- Daily temperature range.
- Relative humidity duration above a threshold.
- Light exposure by hour.
- Soil moisture decline between watering events.
- Vapor pressure deficit, calculated from temperature and humidity.

The [FAO irrigation and evapotranspiration resources](https://www.fao.org/land-water/water/en/) provide useful agricultural context, although a small greenhouse logger will not replace a professional crop-monitoring system.

### 7. Air Quality and CO₂ Monitoring Station

For indoor air studies, CO₂ is often more useful than a vague “air quality” score. The Sensirion SCD40 and SCD41 are popular NDIR CO₂ sensors with temperature and humidity readings.

#### What to log

- CO₂ concentration.
- Temperature.
- Relative humidity.
- Occupancy events, if appropriate.
- Ventilation or fan state.
- Timestamp.

#### Interpreting readings

A CO₂ increase during a meeting may indicate occupancy and ventilation patterns. It does not, by itself, identify every pollutant or prove that air is safe. For health-related interpretation, consult authoritative resources such as the [U.S. Environmental Protection Agency](https://www.epa.gov/indoor-air-quality-iaq).

#### Practical placement

- Keep the sensor away from direct breath.
- Avoid sealed boxes without airflow.
- Do not mount it beside a heat source.
- Record ventilation events.
- Allow warm-up time before treating data as representative.

### 8. Indoor Air Pollution Logger with a Particulate Matter Sensor

Particulate matter sensors such as Plantower modules can report particle concentration through UART or I2C, depending on the model.

#### Project questions

- Does cooking create short PM2.5 spikes?
- How effective is an air purifier?
- Does opening a window reduce concentration?
- How long do readings take to return to baseline?

#### Design cautions

- Follow the sensor’s airflow and orientation requirements.
- Protect the inlet from dust clumps and insects.
- Avoid interpreting one sensor as a regulatory monitor.
- Compare repeated tests under similar conditions.
- Log fan or purifier state.

The [World Health Organization air-quality resources](https://www.who.int/health-topics/air-pollution) provide health context, while the sensor datasheet explains what the hardware actually measures.

### 9. Light Intensity and Energy-Saving Data Logger

A light logger can combine illumination data with occupancy and power measurements.

#### Hardware options

- BH1750 for simple lux measurement.
- TSL2591 for a wider dynamic range.
- PIR sensor for motion.
- INA219 for DC current and voltage.
- Smart plug with an accessible local API for mains monitoring.

#### Example experiment

1. Place the light sensor at desk height.
2. Record lux every 10 seconds.
3. Record motion events.
4. Record lamp state.
5. Compare brightness and occupancy.
6. Calculate hours when lights were on unnecessarily.

Never work directly with mains voltage unless you are qualified and using certified, enclosed equipment. A low-voltage current sensor is a much friendlier learning platform.

### 10. Raspberry Pi Sound Level Monitoring Project

A Raspberry Pi can log relative sound levels using a USB microphone, I2S microphone, or suitable analog front end.

#### Important distinction

A microphone amplitude reading is not automatically a calibrated decibel measurement. Accurate sound-level measurement requires:

- Known microphone sensitivity.
- Appropriate sampling.
- Frequency weighting, such as A-weighting.
- Calibration against a reference.
- Suitable acoustic placement.

For education, a relative noise index can still be useful:

- Quiet period.
- Normal activity.
- Suden event.
- Repeated peak pattern.

Log short statistical summaries rather than storing raw audio when privacy matters. A data logger should measure the environment, not accidentally become a covert recorder.

### 11. Motion, Occupancy, and Door Activity Logger

A PIR sensor can detect movement, while a reed switch or Hall-effect sensor can record door openings.

#### Example fields

| Field | Meaning |
|---|---|
| `motion_state` | Motion detected or not |
| `door_state` | Open or closed |
| `event_time` | Timestamp of transition |
| `duration` | Time spent in state |
| `battery_voltage` | Logger health |
| `software_version` | Reproducibility |

For occupancy studies, avoid collecting personally identifiable information unless there is a clear, lawful reason and appropriate consent. Event counts are often enough.

### 12. Vibration and Machine Condition Monitoring Logger

Vibration is where many Raspberry Pi projects overpromise. A basic accelerometer can reveal broad changes, but meaningful frequency analysis requires:

- Adequate sampling rate.
- Known sensor bandwidth.
- Low-noise wiring.
- Proper mechanical mounting.
- Consistent machine operating conditions.
- Signal processing.

#### Practical approach

1. Start with a low-rate trend logger.
2. Measure RMS acceleration over fixed windows.
3. Compare readings during known healthy operation.
4. Add frequency-domain analysis only after validating the time-domain data.
5. Store raw or summarized data based on storage and diagnostic needs.

For high-speed industrial vibration, dedicated acquisition hardware may be more appropriate than a general-purpose Pi GPIO setup. The [National Instruments measurement fundamentals](https://www.ni.com/docs/en-US/bundle/ni-daqmx/page/measurement-fundamentals.html) offer useful background on acquisition concepts.

### 13. Water Temperature, Level, and Leak Detection Logger

Water monitoring projects range from aquarium logging to basement leak detection.

#### Sensors

- Waterproof DS18B20 for temperature.
- Float switch for level.
- Conductive or capacitive leak sensor.
- Ultrasonic or time-of-flight distance sensor for non-contact level measurement.
- Pressure transducer with ADC for tanks.

#### Reliability tips

- Use waterproof connectors.
- Keep the Pi electrically isolated from pumps.
- Add debounce logic to float switches.
- Record raw sensor states as well as interpreted events.
- Test false positives using splashes, condensation, and cable movement.

A leak detector that sends 40 alerts during one damp afternoon will soon be ignored. Add hysteresis and event grouping so the system reports meaningful changes.

### 14. GPS Location, Speed, and Travel Data Logger

A GPS module connected by UART can record:

- Latitude and longitude.
- Speed.
- Altitude.
- Heading.
- Satellite count.
- Fix quality.
- Timestamp.

#### Build steps

1. Connect the GPS module using the correct UART voltage levels.
2. Confirm the serial device appears in Raspberry Pi OS.
3. Parse NMEA sentences with a suitable Python library.
4. Ignore invalid fixes.
5. Record the raw sentence or selected fields.
6. Use UTC timestamps from the GPS when available.
7. Buffer data when the signal is lost.
8. Export the track as GPX or GeoJSON.

Location data can be sensitive. Protect logs, remove unnecessary precision when sharing, and avoid publishing home addresses or private routes.

### 15. Multi-Sensor IoT Data Logger with MQTT and Node-RED

MQTT is useful when multiple devices publish readings to a broker. Node-RED can subscribe, transform, route, and display those messages.

#### Example topic structure

```text
home/greenhouse/temperature
home/greenhouse/humidity
home/greenhouse/soil_moisture
home/greenhouse/status
``

#### Message example

```json
{
 "device": "greenhouse-pi",
 "timestamp": "2026-09-18T12:00:00Z",
 "temperature_c": 24.3,
 "humidity_percent": 58.1
}
``

#### Build steps

1. Install an MQTT broker such as [Eclipse Mosquito](https://mosquito.org/).
2. Create authenticated users.
3. Define topic names before writing device code.
4. Publish JSON with timestamps and device identifiers.
5. Configure Node-RED flows.
6. Store messages in SQLite or InfluxDB.
7. Add retained status messages carefully.
8. Test broker behavior during network outages.
9. Secure the broker with TLS when traffic leaves a trusted local network.

The first video perspective linked at [#featured-video](#featured-video) is refreshingly practical: “This is how I run my setup” followed by “Have a nice day.” That captures an underrated engineering principle: a working, understandable setup beats a theatrical one. Build the boring version first; make it clever only after it survives a week.

## Installing Python Libraries for Raspberry Pi Sensors

Raspberry Pi OS supports several hardware-access approaches. Choose libraries based on the sensor’s protocol, maintenance status, and documentation quality.

### gpiozero, RPi.GPIO, and libgpiod

- **gpiozero:** Friendly abstraction for buttons, LEDs, motors, and simple devices.
- **RPi.GPIO:** Familiar in older tutorials, but project compatibility depends on the operating system and Raspberry Pi model.
- **libgpiod tools and bindings:** A modern Linux approach to GPIO character devices.

The [gpiozero documentation](https://gpiozero.readthedocs.io/) is particularly approachable for education. For lower-level GPIO behavior, consult the [Linux GPIO documentation](https://www.kernel.org/doc/html/latest/driver-api/gpio/index.html).

### I2C and SPI Communication Libraries

For I2C:

- Enable the interface.
- Detect the device.
- Confirm the address.
- Install the vendor-supported library.
- Run the example before integrating it into a logger.

For SPI:

- Enable SPI.
- Confirm chip-select wiring.
- Check mode and clock settings.
- Test at a conservative speed before increasing performance.

### Adafruit CircuitPython and Manufacturer SDKs

[Adafruit CircuitPython](https://circuitpython.org/) offers a consistent library style across many sensors. Manufacturer libraries can expose more device-specific features.

We generally choose:

- **Manufacturer library** when calibration, advanced configuration, or special operating modes matter.
- **CircuitPython library** when teaching, protyping, or supporting several common breakout boards.
- **Direct register access** only when necessary and well documented.

Do not blindly copy a five-year-old tutorial. Check:

- Raspberry Pi OS version.
- Python version.
- Library maintenance date.
- Raspberry Pi model.
- Sensor revision.
- Voltage requirements.

## Building a Python Sensor Logging Script

A reliable script should separate responsibilities:

```text
read_sensor()
validate_reading()
timestamp_reading()
store_reading()
report_health()
``

That structure makes testing easier than placing wiring, calculations, file operations, and dashboard code inside one enormous `while True` loop.

### Read Sensor Values Safely

A robust sensor read should:

1. Attempt the read.
2. Validate returned values.
3. Catch communication exceptions.
4. Retry a limited number of times.
5. Record an error status if the read fails.
6. Continue logging other sensors where possible.

Example validation rules:

- Temperature between a plausible environmental range.
- Relative humidity between 0 and 100%.
- Pressure within an expected local range.
- No NaN or infinite values.
- Sensor status indicates a valid measurement.

### Add Timestamps and Time Zones

Use UTC for machine-to-machine data and convert to local time for display. Python’s [`datetime`](https://docs.python.org/3/library/datetime.html) documentation explains timezone-aware date handling.

Good timestamp fields include:

- `timestamp_utc`
- `timestamp_local`
- `unix_time`
- `sample_sequence`

Avoid ambiguous strings such as `03/04/26 12:05`, which could represent different dates depending on region.

### Write Sensor Data to CSV

CSV remains useful because nearly every spreadsheet and analysis tool understands it.

#### Good CSV practices

- Write a header row.
- Use consistent units in column names.
- Quote fields when needed.
- Append rather than overwrite.
- Flush deliberately.
- Rotate very large files.
- Include firmware or software version in metadata.
- Use a temporary file when exporting a final report.

Example columns:

```text
timestamp_utc,temperature_c,humidity_percent,pressure_hpa,sensor_status
``

### Store Measurements in SQLite

SQLite is a strong middle ground for Raspberry Pi logging:

- It is built into Python.
- It stores structured records.
- It supports queries.
- It avoids one-file-per-reading chaos.
- It works offline.

Suggested schema:

```sql
CREATE TABLE readings (
 id INTEGER PRIMARY KEY,
 timestamp_utc TEXT NOT NULL,
 temperature_c REAL,
 humidity_percent REAL,
 pressure_hpa REAL,
 status TEXT NOT NULL
);
``

Add indexes on timestamps when the dataset grows. Use transactions rather than committing every single reading if the sampling rate is high.

### Handle Sensor Errors, Missing Values, and Retries

Do not replace a failed read with zero. Zero humidity, zero pressure, or zero temperature may look legitimate and corrupt your analysis.

Better options:

- Store `NULL`.
- Store an error code.
- Store the number of retries.
- Store the last known value only as a clearly labeled derived field.
- Alert when consecutive failures exceed a threshold.

### Run a Logger Continuously with systemd

A `systemd` service can start your logger at boot and restart it after a crash.

A good service configuration should define:

- A dedicated user.
- The working directory.
- The Python virtual environment.
- Restart behavior.
- Log destination.
- Required device permissions.
- Network dependencies only when necessary.

Do not run everything as root. The [systemd documentation](https://www.fredesktop.org/software/systemd/man/latest/systemd.service.html) explains service behavior and security controls.

## Raspberry Pi Data Storage Options

### CSV Files for Simple Sensor Experiments

Choose CSV when:

- One process writes the data.
- The sampling rate is modest.
- Human inspection matters.
- You expect to move data into Excel, LibreOffice Calc, or pandas.

CSV becomes awkward when:

- Multiple services write simultaneously.
- You need fast time-range queries.
- The schema changes frequently.
- The file grows for months.
- Power interruptions occur during writes.

### SQLite for Reliable Local Logging

SQLite suits:

- Home monitoring.
- Sensor networks with one local gateway.
- Offline-first field logers.
- Structured analysis.

Use database maintenance practices:

- Periodic backups.
- WAL mode where appropriate.
- Indexes for common queries.
- Integrity checks.
- Careful transaction boundaries.

The official [SQLite documentation](https://www.sqlite.org/docs.html) is clear and comprehensive.

### InfluxDB and Time-Series Databases

InfluxDB is designed around measurements over time. Pairing it with Grafana creates a polished monitoring stack.

✅ **Benefits**

- Time-range queries.
- Efficient time-series workflows.
- Tags for device and location.
- Dashboard integration.
- Threshold alerts.

❌ **Drawbacks**

- More administration.
- Version differences matter.
- A Pi’s storage still needs protection.
- Poorly chosen tags can create excessive series cardinality.

### MySQL, PostgreSQL, and Remote Databases

Use PostgreSQL or MySQL when:

- Several users or applications need the data.
- You already operate a database server.
- Relational queries matter.
- Access control and replication are important.

A Raspberry Pi can act as a client, but storing critical data only on an exposed Pi is not ideal. Consider a remote database with local buffering.

### USB Drives, SSDs, and Network-Attached Storage

For write-heavy projects:

- A USB SSD can offer better endurance and performance than a microSD card.
- A network share can centralize storage.
- A local database plus scheduled backup provides resilience.

Do not assume a USB drive eliminates failure. Every storage device needs backups, safe shutdown handling, and health monitoring.

## Visualizing Raspberry Pi Sensor Data

A table of numbers is valuable. A graph often reveals the story hiding between them.

### Grafana Dashboards for Real-Time Monitoring

Grafana works especially well with InfluxDB, PostgreSQL, and other data sources.

Useful panels include:

- Current sensor values.
- 24-hour trend.
- Daily minimum and maximum.
- Data freshness.
- Logger uptime.
- Error count.
- Battery voltage.
- Missing sample count.

A dashboard should answer a question quickly. If it has 27 gauges and none explains whether the greenhouse needs ventilation, it is decorative plumbing.

### Plotly, Matplotlib, and Jupyter Notebook Charts

Python tools are ideal for analysis:

- **Matplotlib:** Stable, flexible static charts.
- **Plotly:** Interactive browser-based charts.
- **pandas:** Data cleaning and time-series operations.
- **Jupyter:** Reproducible exploration.

Typical analysis workflow:

1. Load CSV or query SQLite.
2. Parse timestamps.
3. Sort rows.
4. Detect missing values.
5. Resample to useful intervals.
6. Calculate rolling averages.
7. Plot raw and smoothed values.
8. Investigate outliers.
9. Export a report.

### Node-RED Dashboards and Home Assistant

[Node-RED](https://nodered.org/) is useful for visual flows and integrations. [Home Assistant](https://www.home-assistant.io/) is especially attractive when sensor data should trigger household automation.

Examples:

- Turn on a fan when temperature exceeds a threshold.
- Notify when a freezer warms unexpectedly.
- Record door-open duration.
- Show soil moisture beside irrigation status.

### Exporting Data to Google Sheets and Cloud Platforms

Cloud spreadsheets are convenient for sharing, but avoid making them the only copy. Use:

- Local buffering.
- Retry queues.
- Authentication tokens stored outside source code.
- Rate-limit handling.
- Periodic exports.

## Sending Sensor Readings to the Cloud

### MQTT Messaging with Mosquito

MQTT uses a publish-and-subscribe model:

- Sensors publish messages.
- A broker receives them.
- Dashboards or applications subscribe.

Important MQTT concepts:

- Quality of Service.
- Retained messages.
- Last-will messages.
- Topic hierarchy.
- Authentication.
- TLS encryption.

The [OASIS MQTT specification](https://mqtt.org/mqtt-specification/) provides the protocol details.

### HTTP APIs, Webhooks, and REST Services

HTTP is convenient when sending data to:

- A custom web application.
- A cloud function.
- An automation platform.
- A database ingestion endpoint.

Use:

- HTTPS.
- Authentication.
- Input validation.
- Retries with backoff.
- Local queues for outages.
- Idempotent message identifiers where duplicate uploads are possible.

### AWS IoT, Azure IoT, and Google Cloud Options

Cloud IoT services can provide fleet management, certificates, device registries, and analytics. They also introduce operational complexity.

For one home project, MQTT on a local network may be enough. For hundreds of remote devices, managed cloud infrastructure may justify itself.

Ask:

- Who owns the data?
- What happens when the internet fails?
- How are credentials rotated?
- How will devices be updated?
- What is the backup strategy?
- Can you export your data?

### Choosing the Best Internet Connection

- **Wi-Fi:** Convenient for homes and buildings.
- **Ethernet:** Stable and low-latency.
- **Cellular:** Useful for remote sites, but power and data plans matter.
- **LoRaWAN:** Long range and low power for small payloads.
- **No connection:** Best for privacy and simple offline logging.

A logger that stores locally can use any connection as an optional enhancement rather than a single point of failure.

## Sampling Rates, Calibration, and Measurement Accuracy

### How Often Should a Raspberry Pi Read a Sensor?

Use the fastest rate required by the phenomenon, then validate the result. Oversampling may help with noise, but only when the sensor and system support it.

For a periodic process with important frequency content, sampling must be sufficiently fast to capture that content. The [National Institute of Standards and Technology](https://www.nist.gov/pml) provides measurement science resources, while sensor datasheets provide practical bandwidth and response information.

### Sensor Calibration and Baseline Testing

Calibration can mean different things:

- Comparing against a traceable reference.
- Adjusting an offset.
- Fitting a conversion curve.
- Mapping raw ADC values to a local scale.
- Verifying repeatability.

Record calibration metadata:

- Date.
- Reference instrument.
- Environmental conditions.
- Sensor serial number.
- Calibration coefficients.
- Person or process responsible.

### Filtering Noise and Detecting Outliers

Common techniques:

- Moving average.
- Median filter.
- Exponential smoothing.
- Hampel filter.
- Rate-of-change limits.
- Physical plausibility checks.

Do not filter away unusual values merely because they look inconvenient. A temperature spike may be a faulty sensor, or it may be the moment the greenhouse door opened.

### Preventing Clock Drift and Incorrect Timestamps

Options include:

- Network Time Protocol.
- GPS time.
- Real-time clock module.
- Monotonic elapsed-time measurements for interval control.

Use wall-clock time for records and a monotonic clock for scheduling. A system clock correction should not make a one-minute interval suddenly appear to be negative.

## Securing a Raspberry Pi IoT Data Logger

### Change Default Credentials and Disable Unecessary Services

Start with:

- A unique user password.
- SSH keys.
- Disabled password login where appropriate.
- Disabled unused services.
- A firewall.
- Regular operating-system updates.

The [Raspberry Pi security guidance](https://www.raspberrypi.com/documentation/computers/configuration.html#changing-the-default-password) provides practical setup advice.

### Use SSH Keys, Firewalls, and Automatic Updates

Do not expose SSH directly to the public internet without a very good reason. Prefer:

- VPN access.
- Tailscale or another trusted private networking solution.
- Firewall rules.
- Key-based authentication.
- Limited administrative accounts.

### Protect MQTT Brokers, APIs, and Cloud Credentials

Never hard-code credentials in a public repository. Use:

- Environment variables.
- File permissions.
- Secret managers.
- TLS certificates.
- Short-lived tokens where supported.
- Separate credentials per device.

### Back Up Sensor Logs and Recover from SD Card Failure

A backup is useful only if recovery has been tested.

Use:

- Scheduled database dumps.
- Rotated local backups.
- Remote encrypted copies.
- Read-only or minimized write patterns where possible.
- A documented rebuild procedure.

Test by restoring to another Raspberry Pi or virtual machine. “The files exist somewhere” is not a recovery plan.

## Troubleshooting Raspberry Pi Sensor Logging Problems

### Sensor Not Detected on the I2C Bus

Check:

1. I2C is enabled.
2. SDA and SCL are not reversed.
3. Ground is connected.
4. Voltage is correct.
5. The device address is correct.
6. Pull-ups are present but not excessive.
7. Another device is not holding the bus low.
8. The sensor is not in SPI mode.

Run a bus scan and compare the result with the datasheet. A missing address is a hardware or configuration clue, not a Python mystery.

### GPIO Permission and Python Module Errors

Typical causes:

- Running the wrong Python interpreter.
- Installing packages outside the active virtual environment.
- Missing group permissions.
- Using an outdated GPIO library.
- Confusing board pin numbers with GPIO numbers.

Use a virtual environment and document its dependencies in `requirements.txt`.

### Corupt CSV Files or Empty Database Tables

Investigate:

- Write mode versus append mode.
- File permissions.
- Abrupt power loss.
- Unhandled exceptions.
- Incorrect working directory.
- Database commits.
- Storage exhaustion.
- A service running as a different user.

Log the absolute file path at startup. This simple line has saved more debugging time than many elaborate tools.

### Wi-Fi Dropouts and Cloud Upload Failures

Build an offline queue:

1. Write the measurement locally.
2. Mark it as unsent.
3. Attempt transmission.
4. Mark it as sent only after confirmation.
5. Retry with backoff.
6. Delete data only after verified retention.

### Overheating, Brownouts, and Random Reboots

Check:

- Power-supply rating.
- USB cable quality.
- Throttling indicators.
- CPU temperature.
- Enclosure airflow.
- Storage health.
- Kernel logs.
- Loose connectors.

The [Raspberry Pi documentation on power supplies](https://www.raspberrypi.com/documentation/computers/raspberry-pi.html#power-supply) is a useful starting point.

## Testing and Validating Your Sensor Data Logger

### Bench Testing Before Field Deployment

Run the logger on a desk for at least a day. Test:

- Reboot recovery.
- Sensor unpluging.
- Network loss.
- Full disk behavior.
- Invalid readings.
- Clock changes.
- Service restart.
- Data export.

### Compare Readings with a Trusted Instrument

Use a reference thermometer, hygrometer, pressure sensor, or multimeter. Compare:

- Offset.
- Drift.
- Response time.
- Repeatability.
- Behavior during rapid changes.

A reference instrument is not automatically perfect, but it gives you a basis for checking plausibility.

### Monitor Uptime, Storage, and Sensor Health

Log metadata such as:

- Process uptime.
- CPU temperature.
- Free disk space.
- Memory use.
- Wi-Fi signal strength.
- Sensor error count.
- Last successful reading.
- Software version.

The most useful dashboard panel may be “last reading received: 3 minutes ago.” A beautiful graph of stale data is a very polished lie.

## Deploying Raspberry Pi Data Logers Indors and Outdoors

### Weatherproofing and Condensation Protection

Outdoor electronics need more than a plastic box:

- Use cable glands.
- Prevent water from tracking along cables.
- Keep sensor openings protected from direct rain.
- Allow appropriate ventilation.
- Use conformal coating only where it will not block sensor operation.
- Manage condensation.
- Separate heat-generating electronics from environmental sensors.

### Remote Monitoring and Maintenance

Remote deployments should support:

- Health pings.
- Automatic restart.
- Secure remote access.
- Configuration backup.
- Log rotation.
- Data synchronization.
- A physical recovery plan.

If the logger is mounted on a roof, “walk over and reboot it” is not a maintenance strategy. It is a future anecdote.

### Battery Life and Low-Power Design

A full Linux Raspberry Pi consumes more energy than a microcontroller. Improve battery life by:

- Increasing the logging interval.
- Disabling unused peripherals.
- Using a Pi Zero 2 W where suitable.
- Scheduling wake-and-log cycles.
- Moving high-frequency acquisition to a Raspberry Pico W.
- Choosing efficient cellular or LoRaWAN hardware.
- Measuring real current draw rather than trusting estimates.

## Improving Raspberry Pi Sensor Projects

### Add Alerts, Relays, and Automated Actions

Useful actions include:

- Email or push notification.
- Fan control.
- Pump control.
- Heater shutdown.
- Local LED or buzer.
- Webhook to a home-automation platform.

Use hysteresis:

- Turn a fan on above 28 °C.
- Turn it off below 26 °C.

Without hysteresis, the relay may chatter around one threshold.

### Scale from One Sensor to a Distributed Network

For multiple locations:

- Give every device a unique ID.
- Use consistent units.
- Standardize timestamps.
- Version message formats.
- Include battery and health data.
- Buffer locally.
- Secure device credentials individually.

A distributed network should be boringly consistent. If one node calls a field `temp`, another calls it `temperature`, and a third sends `degrees`, your dashboard will eventually develop trust issues.

### Use Machine Learning for Forecasting and Anomaly Detection

Machine learning can help after you have:

- Clean historical data.
- Stable timestamps.
- Known sensor behavior.
- Sufficient examples of normal operation.
- Clearly defined failure cases.

Start with simpler tools:

- Rolling averages.
- Seasonal baselines.
- Thresholds.
- Linear regression.
- Isolation Forest for exploratory anomaly detection.

A neural network cannot rescue a sensor installed beside a radiator with an incorrect timestamp.

## Raspberry Pi Sensor Data Logging Project Ideas by Skill Level

### Beginner Raspberry Pi Logging Projects

Recommended first builds:

- DHT22 temperature and humidity logger.
- BME280 CSV logger.
- Sense HAT data logger.
- Door-open event counter.
- Light-level logger with BH1750.

Focus on:

- Wiring safely.
- Reading one device.
- Adding timestamps.
- Writing valid data.
- Recovering from a reboot.

### Intermediate Sensor Monitoring Projects

Try:

- Soil moisture logger with ADS1115.
- Greenhouse monitoring station.
- GPS travel logger.
- CO₂ dashboard.
- Raspberry Pi weather station.
- SQLite-backed home environment logger.

Add:

- Calibration.
- Error handling.
- Charts.
- Automatic startup.
- Backups.

### Advanced Industrial and IoT Data Logging Projects

Explore:

- MQTT sensor networks.
- InfluxDB and Grafana.
- Vibration analysis.
- Cellular remote logging.
- LoRaWAN gateways.
- Edge processing.
- Device authentication.
- Fleet health monitoring.

At this level, the hard part is rarely reading the sensor. It is ensuring the system remains correct, secure, maintainable, and interpretable.

## Common Raspberry Pi Data Logging Mistakes to Avoid

- ❌ Choosing a sensor before defining the measurement.
- ❌ Connecting a 5 V signal to GPIO.
- ❌ Ignoring the lack of analog inputs.
- ❌ Logging too frequently without a reason.
- ❌ Using local time without a timezone.
- ❌ Overwriting the log on restart.
- ❌ Treating invalid readings as zero.
- ❌ Running as root unnecessarily.
- ❌ Relying on cloud connectivity for the only copy of data.
- ❌ Placing an environmental sensor beside the Pi’s processor.
- ❌ Ignoring calibration.
- ❌ Using a generic indoor enclosure outdoors.
- ❌ Forgeting to monitor free storage.
- ❌ Assuming a forum quote is verified when the page cannot be accessed.
- ❌ Building a dashboard before proving the data is trustworthy.

The [Why Pi DIY Electronics category](https://www.whypi.org/category/diy-electronics/) is a useful place to explore related build ideas, while the [Electronic Component Reviews category](https://www.whypi.org/category/electronic-component-reviews/) can help when comparing sensor boards and accessories.

## Raspberry Pi Sensor Data Format and Privacy Considerations

A good record should answer:

- What was measured?
- Where was it measured?
- When was it measured?
- With which device?
- In what units?
- Was the measurement valid?
- What software produced it?

Example:

```json
{
 "device_id": "greenhouse-pi-01",
 "timestamp_utc": "2026-09-18T12:00:00Z",
 "sensor": "sht31",
 "temperature_c": 24.3,
 "humidity_percent": 58.1,
 "status": "ok",
 "software_version": "1.4.0"
}
``

### Privacy questions to ask

- Does the logger record location?
- Could sound data identify people?
- Are occupancy events sensitive?
- Who can access the dashboard?
- How long should records be retained?
- Are cloud credentials protected?
- Is the device visible from the public internet?

Data minimization is usually the kindest design. Store what you need, protect what you keep, and avoid turning a plant monitor into an accidental surveillance system.

## Recommended Hardware and Software

For most readers, our practical stack is:

### Beginner stack

- Raspberry Pi 4 Model B or Raspberry Pi Zero 2 W.
- BME280 or Sense HAT.
- Raspberry Pi OS.
- Python.
- CSV.
- Matplotlib.

### Reliable home-monitoring stack

- Raspberry Pi 4 or Raspberry Pi 5.
- BME280, SHT31, SCD41, or a suitable particulate sensor.
- SQLite or InfluxDB.
- Grafana.
- systemd.
- Local backups.
- MQTT if multiple devices are involved.

### Low-power remote stack

- Raspberry Pi Zero 2 W for Linux flexibility.
- Raspberry Pico W when battery life is the priority.
- DS18B20, SHT31, or low-power analog sensors.
- Battery monitoring.
- Local buffering.
- LoRaWAN or cellular connectivity where Wi-Fi is unavailable.

👉 **CHECK PRICE on:**

- **Raspberry Pi Sense HAT:** [Amazon](https://www.amazon.com/s?k=Raspberry+Pi+Sense+HAT&tag=bestbrands0a9-20) | [Official Raspberry Pi](https://www.raspberrypi.com/products/sense-hat/)
- **Raspberry Pico W:** [Amazon](https://www.amazon.com/s?k=Raspberry+Pi+Pico+W&tag=bestbrands0a9-20) | [Official Raspberry Pi](https://www.raspberrypi.com/products/raspberry-pi-pico/)
- **BME280 sensor boards:** [Amazon](https://www.amazon.com/s?k=BME280+sensor+Raspberry+Pi&tag=bestbrands0a9-20) | [Adafruit](https://www.adafruit.com/product/2652)
- **SHT31 sensor boards:** [Amazon](https://www.amazon.com/s?k=SHT31+sensor+Raspberry+Pi&tag=bestbrands0a9-20) | [Sensirion](https://sensirion.com/products/catalog/SHT31-DIS-B-DIS-B-DIS-B)
- **ADS1115 ADC:** [Amazon](https://www.amazon.com/s?k=ADS1115+ADC&tag=bestbrands0a9-20) | [Adafruit](https://www.adafruit.com/product/1085)
- **High-endurance microSD cards:** [Amazon](https://www.amazon.com/s?k=high+endurance+microSD+card&tag=bestbrands0a9-20) | [SanDisk Official](https://www.westerndigital.com/brand/sandisk)

### Useful software

- [Raspberry Pi OS](https://www.raspberrypi.com/software/)
- [Python](https://www.python.org/)
- [gpiozero](https://gpiozero.readthedocs.io/)
- [Adafruit Python libraries](https://github.com/adafruit)
- [SQLite](https://www.sqlite.org/)
- [InfluxDB](https://www.influxdata.com/)
- [Grafana](https://grafana.com/)
- [Node-RED](https://nodered.org/)
- [Mosquito](https://mosquito.org/)
- [Home Assistant](https://www.home-assistant.io/)

## Conclusion

Raspberry Pi sensor data logging projects can be wonderfully simple or impressively sophisticated. The winning design is not the one with the most sensors. It is the one that produces **trustworthy, timestamped, recoverable data**.

Our confident recommendations are:

- Start with a **BME280 or Sense HAT** for environmental learning.
- Choose the **Raspberry Pi Zero 2 W** for compact, modest remote logging.
- Choose the **Raspberry Pi 4 or Pi 5** when you need dashboards, databases, or multiple services.
- Add an **ADS1115** whenever you need to read analog sensors.
- Use **CSV for short experiments**, **SQLite for dependable local storage**, and **InfluxDB plus Grafana** for long-running time-series monitoring.
- Build **offline-first**, then add MQTT or cloud uploads.
- Calibrate and validate before trusting graphs.
- Protect the GPIO pins, power supply, storage, and credentials.

The unanswered question from the beginning was not “Which sensor is coolest?” It was “What makes a logger genuinely useful?” The answer is now clear: define the measurement, sample at a sensible rate, record honest metadata, survive interruptions, and make the results easy to understand. That is how a small Raspberry Pi becomes a dependable scientific instrument instead of a blinking box with ambitions. 🥧

## Recommended Links

### Raspberry Pi boards and accessories

- **Raspberry Pi 5:** [Amazon](https://www.amazon.com/s?k=Raspberry+Pi+5&tag=bestbrands0a9-20) | [Raspberry Pi Official Website](https://www.raspberrypi.com/products/raspberry-pi-5/)
- **Raspberry Pi 4 Model B:** [Amazon](https://www.amazon.com/s?k=Raspberry+Pi+4+Model+B&tag=bestbrands0a9-20) | [Raspberry Pi Official Website](https://www.raspberrypi.com/products/raspberry-pi-4-model-b/)
- **Raspberry Pi Zero 2 W:** [Amazon](https://www.amazon.com/s?k=Raspberry+Pi+Zero+2+W&tag=bestbrands0a9-20) | [Raspberry Pi Official Website](https://www.raspberrypi.com/products/raspberry-pi-zero-2-w/)
- **Raspberry Pico W:** [Amazon](https://www.amazon.com/s?k=Raspberry+Pi+Pico+W&tag=bestbrands0a9-20) | [Raspberry Pi Official Website](https://www.raspberrypi.com/products/raspberry-pi-pico/)
- **Raspberry Pi Sense HAT:** [Amazon](https://www.amazon.com/s?k=Raspberry+Pi+Sense+HAT&tag=bestbrands0a9-20) | [Raspberry Pi Official Website](https://www.raspberrypi.com/products/sense-hat/)

### Sensors and electronics

- **BME280:** [Amazon](https://www.amazon.com/s?k=BME280+breakout+board&tag=bestbrands0a9-20) | [Adafruit Official Website](https://www.adafruit.com/product/2652)
- **SHT31:** [Amazon](https://www.amazon.com/s?k=SHT31+breakout+board&tag=bestbrands0a9-20) | [Sensirion Official Website](https://sensirion.com/products/catalog/SHT31-DIS-B-DIS-B-DIS-B)
- **SCD41 CO₂ sensor:** [Amazon](https://www.amazon.com/s?k=SCD41+CO2+sensor&tag=bestbrands0a9-20) | [Sensirion Official Website](https://sensirion.com/products/catalog/SCD41)
- **ADS1115 ADC:** [Amazon](https://www.amazon.com/s?k=ADS1115+breakout&tag=bestbrands0a9-20) | [Adafruit Official Website](https://www.adafruit.com/product/1085)
- **DS18B20 waterproof sensor:** [Amazon](https://www.amazon.com/s?k=DS18B20+waterproof+Raspberry+Pi&tag=bestbrands0a9-20) | [Analog Devices Official Website](https://www.analog.com/en/products/ds18b20.html)
- **PMSA003I particulate sensor:** [Amazon](https://www.amazon.com/s?k=PMSA003I+particulate+sensor&tag=bestbrands0a9-20) | [Adafruit Official Website](https://www.adafruit.com/product/4632)

### Books and learning resources

- **Raspberry Pi Cookbook:** [Amazon](https://www.amazon.com/s?k=Raspberry+Pi+Cookbook+Simon+Monk&tag=bestbrands0a9-20)
- **Python Crash Course:** [Amazon](https://www.amazon.com/s?k=Python+Crash+Course+Eric+Mathes&tag=bestbrands0a9-20)
- **Make: Sensors:** [Amazon](https://www.amazon.com/s?k=Make+Sensors+Book&tag=bestbrands0a9-20)
- **Raspberry Pi for Dummies:** [Amazon](https://www.amazon.com/s?k=Raspberry+Pi+For+Dummies&tag=bestbrands0a9-20)

### More Why Pi™ resources

- [Raspberry Pi projects and guides](https://www.whypi.org/raspberry-pi/)
- [DIY Electronics](https://www.whypi.org/category/diy-electronics/)
- [Electronic Component Reviews](https://www.whypi.org/category/electronic-component-reviews/)
- [Electronics Industry News](https://www.whypi.org/category/electronics-industry-news/)

## FAQ

### What sensors work best for Raspberry Pi data logging projects?

For most environmental projects, start with a **BME280**, **SHT31**, or **Sense HAT**.

- **BME280:** Temperature, humidity, and pressure over I2C or SPI.
- **SHT31:** Strong choice for temperature and humidity.
- **Sense HAT:** Best for education and multi-sensor demonstrations.
- **SCD41:** Better suited to CO₂ monitoring.
- **DS18B20:** Useful for waterproof temperature measurements.
- **ADS1115 plus a capacitive probe:** Suitable for analog soil-moisture experiments.

Choose based on required accuracy, response time, environment, interface, and calibration—not simply popularity.

### How do you log sensor data with a Raspberry Pi?

1. Choose a compatible sensor.
2. Check voltage and wiring.
3. Enable I2C, SPI, or UART if needed.
4. Install the correct Python library.
5. Read one sensor value.
6. Validate the reading.
7. Add a timezone-aware timestamp.
8. Save the record to CSV, SQLite, or a time-series database.
9. Add retry and error handling.
10. Configure automatic startup with `systemd`.
11. Test power loss, reboot, sensor disconnection, and network failure.

The official [Raspberry Pi Sense HAT data logger tutorial](https://projects.raspberrypi.org/en/projects/sense-hat-data-logger) demonstrates this workflow with Python and CSV.

### What is the best database for storing Raspberry Pi sensor data?

- **CSV:** Best for short, simple experiments.
- **SQLite:** Best default for a standalone Raspberry Pi logger.
- **InfluxDB:** Strong choice for time-series data and Grafana dashboards.
- **PostgreSQL or MySQL:** Better when multiple applications and users need relational data.

For most home and educational builds, we recommend **SQLite first**. Move to InfluxDB when you need long-term time-series dashboards or many measurements.

### How can you visualize Raspberry Pi sensor data in real time?

Use one of these approaches:

- **Grafana with InfluxDB:** Best for polished dashboards.
- **Node-RED Dashboard:** Good for visual flows and quick integrations.
- **Home Assistant:** Excellent when sensor readings should control a smart home.
- **Plotly:** Useful for interactive Python charts.
- **Matplotlib:** Reliable for reports and analysis.

Keep a local database even when using a dashboard. The display is not the archive.

### How do you connect multiple sensors to a Raspberry Pi data logger?

For I2C sensors:

1. Connect all devices to shared SDA, SCL, 3.3 V, and ground.
2. Confirm each device has a unique address.
3. Change an address jumper or use an I2C multiplexer if addresses conflict.
4. Test each sensor individually.
5. Read them in sequence.
6. Store a single timestamped record or separate records with a common sample ID.

SPI devices share clock and data lines but generally need separate chip-select lines. UART devices may require separate serial interfaces or a multiplexer.

### Can a Raspberry Pi log sensor data without an internet connection?

Yes. Store data locally in:

- CSV.
- SQLite.
- InfluxDB.
- A local binary or JSON format.

For accurate timekeeping without internet, add a real-time clock module or use a GPS source. Synchronize to the cloud later when connectivity returns.

### How do you build a low-power Raspberry Pi sensor data logging system?

Start by deciding whether you need Linux. A **Raspberry Pico W** can be more efficient for simple periodic sensing. If you need Raspberry Pi OS, consider a **Pi Zero 2 W**.

Use these strategies:

- Read sensors at sensible intervals.
- Disable unused interfaces.
- Use efficient sensors.
- Schedule wake-and-log cycles.
- Buffer data locally.
- Measure current draw.
- Add battery-voltage monitoring.
- Use LoRaWAN or low-bandwidth cellular communication where appropriate.
- Avoid powering high-current peripherals continuously.

### Can Raspberry Pi GPIO read analog sensor values?

No. Standard Raspberry Pi GPIO pins are digital. Add an ADC such as the [ADS1115](https://www.adafruit.com/product/1085) or MCP3008 to measure analog voltage.

### How accurate are Raspberry Pi sensor readings?

Accuracy depends on:

- Sensor model and grade.
- Calibration.
- Supply voltage.
- Wiring.
- Placement.
- Temperature.
- Humidity.
- Sampling method.
- Software validation.

A Raspberry Pi reads the sensor; it does not magically improve the sensor’s accuracy. Use the datasheet’s stated limits and compare measurements with a suitable reference.

### How do you prevent SD card corruption in a Raspberry Pi data logger?

- Use a high-endurance card.
- Avoid unnecessary write frequency.
- Buffer or batch writes.
- Shut down safely.
- Use a UPS or battery backup.
- Keep free storage available.
- Back up logs remotely.
- Consider a USB SSD for heavier workloads.
- Test recovery after an unexpected power loss.

### Should you use `sleep()` in a Raspberry Pi sensor logger?

`sleep()` is acceptable for many slow environmental sensors. However, the official Sense HAT data logger tutorial recommends comparing timestamps rather than relying only on `sleep()` for timing, particularly because some IMU readings can be affected by timing behavior.

For more robust scheduling:

- Use a monotonic clock for intervals.
- Use timestamp comparisons for records.
- Separate acquisition frequency from write frequency.
- Avoid blocking the entire program when multiple sensors need attention.

### How do you calibrate a Raspberry Pi soil-moisture sensor?

1. Record the raw ADC value in dry soil.
2. Record the value after thoroughly weting and draining the soil.
3. Repeat across the actual soil mixture.
4. Map the raw range to a relative scale.
5. Validate readings against watering events and plant behavior.
6. Recalibrate if the probe, soil, or installation changes.

Do not treat a generic “percentage” as universal.

### How do you secure Raspberry Pi sensor data?

- Use strong unique credentials.
- Prefer SSH keys.
- Keep Raspberry Pi OS updated.
- Restrict network exposure.
- Encrypt cloud connections.
- Protect MQTT credentials.
- Avoid hard-coded secrets.
- Use separate device identities.
- Back up data securely.
- Minimize personal or location-sensitive information.

## Reference Links

- [Raspberry Pi Official Documentation](https://www.raspberrypi.com/documentation/)
- [Raspberry Pi Products](https://www.raspberrypi.com/products/)
- [Raspberry Pi GPIO and hardware documentation](https://www.raspberrypi.com/documentation/computers/raspberry-pi.html#gpio)
- [Raspberry Pi OS software](https://www.raspberrypi.com/software/)
- [Raspberry Pi Sense HAT data logger project](https://projects.raspberrypi.org/en/projects/sense-hat-data-logger)
- [Raspberry Pi Sense HAT product page](https://www.raspberrypi.com/products/sense-hat/)
- [Raspberry Pico product page](https://www.raspberrypi.com/products/raspberry-pi-pico/)
- [Adafruit BME280 guide](https://learn.adafruit.com/adafruit-bme280-humidity-barometric-pressure-temperature-sensor-breakout/python-circuitpython-test-test)
- [Adafruit DHT sensor guide](https://learn.adafruit.com/dht)
- [Adafruit ADS1115 product page](https://www.adafruit.com/product/1085)
- [Sensirion SHT31 product information](https://sensirion.com/products/catalog/SHT31-DIS-B-DIS-B-DIS-B)
- [Sensirion SCD4x CO₂ sensor information](https://sensirion.com/products/catalog/SCD41)
- [Bosch Sensortec BME280 information](https://www.bosch-sensortec.com/products/environmental-sensors/humidity-sensors-bme280/)
- [Python `datetime` documentation](https://docs.python.org/3/library/datetime.html)
- [gpiozero documentation](https://gpiozero.readthedocs.io/)
- [SQLite documentation](https://www.sqlite.org/docs.html)
- [InfluxDB documentation](https://docs.influxdata.com/)
- [Grafana documentation](https://grafana.com/docs/)
- [Node-RED documentation](https://nodered.org/docs/)
- [Eclipse Mosquito](https://mosquito.org/)
- [MQTT specification](https://mqtt.org/mqtt-specification/)
- [Home Assistant documentation](https://www.home-assistant.io/docs/)
- [National Institute of Standards and Technology](https://www.nist.gov/)
- [U.S. Environmental Protection Agency indoor air quality resources](https://www.epa.gov/indoor-air-quality-iaq)
- [World Health Organization air pollution resources](https://www.who.int/health-topics/air-pollution)
- [Why Pi™ Raspberry Pi resources](https://www.whypi.org/raspberry-pi/)
- [Why Pi™ DIY Electronics](https://www.whypi.org/category/diy-electronics/)
- [Why Pi™ Electronic Component Reviews](https://www.whypi.org/category/electronic-component-reviews/)
- [Why Pi™ Electronics Industry News](https://www.whypi.org/category/electronics-industry-news/)